In Photography, we have seen that we easily understand many concepts and at one place we get stuck. It is just like to see many students talking about mathematics subject that it is very tough and very difficult for me to get a pass on that particular subject. This kind of thinking is not because of the subject but due to our own mindset. If we have confidence and confidence comes with a clear concept and hard work, then only we can clear any obstacle and no subject will be any longer tough.
Similarly, we need to ask a few questions.
what is the need of Histogram?
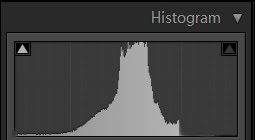
The importance or need of histogram is to understand the exposure in just one eye scan or in bird eye view. A histogram contains shadow, mid tones & highlights. A good image is considered to be one with spread out histogram. This is not always, sometimes it can be or sometimes it may be not.
When do we need to use Histograms?
The histogram is not the final way of judging your image, it is helpful when you want to take a shot with the same settings or when you are unable to look at your camera LCD screen, under such conditions it is a good way of judging your images.
What does a Histogram represent?
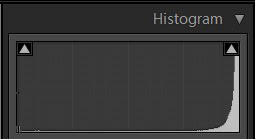
A histogram is a graph that represents the data distribution, here data distribution means dark, mid tone & white areas if we speak in simple terms. This gives you a clear understanding of where the dark area is and how the mid tones are and how much brightness is in your image.
From the above description, you must be now clear of your concepts related to the histogram. We can move on with this much of detail to understand all the more about Histogram activities, to track it's movement in photography. How to utilize the facility provided in camera to make the best of its use.
Now the question arises what does it mean if the graph moves left or middle graph or to the right of the histogram?
I won't explain it in detail but in simple words that it means the darkness is more in your image. This can be due to the dark background in your image, the more the darker area, the more graph will move to the left, representing darkness.
If the graph is in the middle then it means that there is no contrast or low contrast. It means you need to give some more exposure to your image, this makes you clear that the contrast is low.
Now, you will ask what is a contrast?
We see the color difference comes with the difference between dark and light shade if the contrast is not there then you will get black & white and grey shade in your images. Contrast is basically the difference between the black and white in your image. You can even check this by using contrast scale in your lightroom editing software, from there you will understand how an increased contrast adds darkness to the different colors in your image.
If the graph is to the right, then it simply means that the brightness is more in your image. This can be due to the bright background in your image, the more the brighter area, the more graph will move to the right, representing brightness.
This you can understand from the following images along with the graph.


0 comments:
Post a Comment